I took two years of NYPD arrest records — over 500,000 rows — and built a pipeline to clean, model, and visualize them. The goal was to surface patterns in when, where, and what types of arrests happen across New York City. Public data like this is messy and underdocumented, so a big part of the work was just making it usable.
The Process
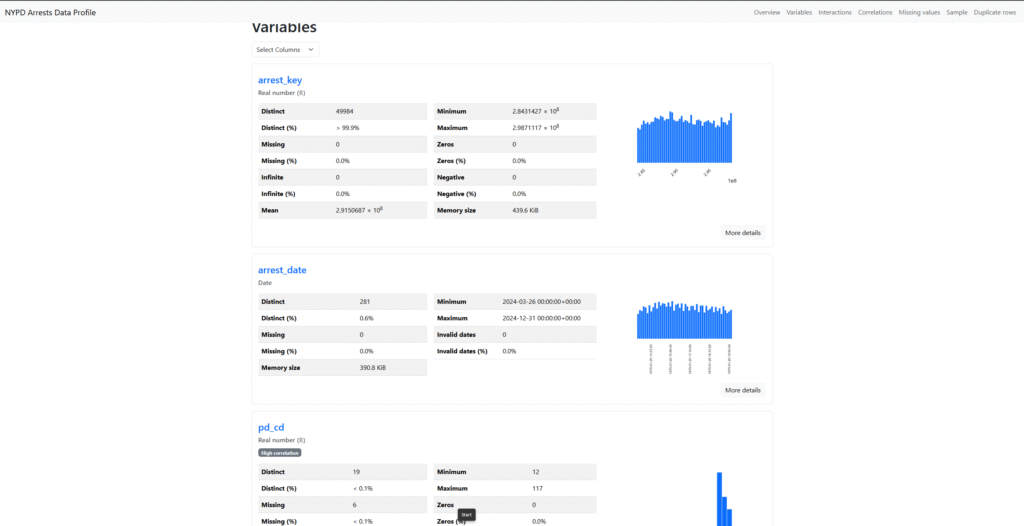
Profiling with pandas
Before touching any tooling, I profiled the raw dataset in Python to understand what I was working with: missing value rates, column consistency, date ranges, and demographic distributions. This step usually surfaces the most important cleaning decisions before you commit to a workflow.
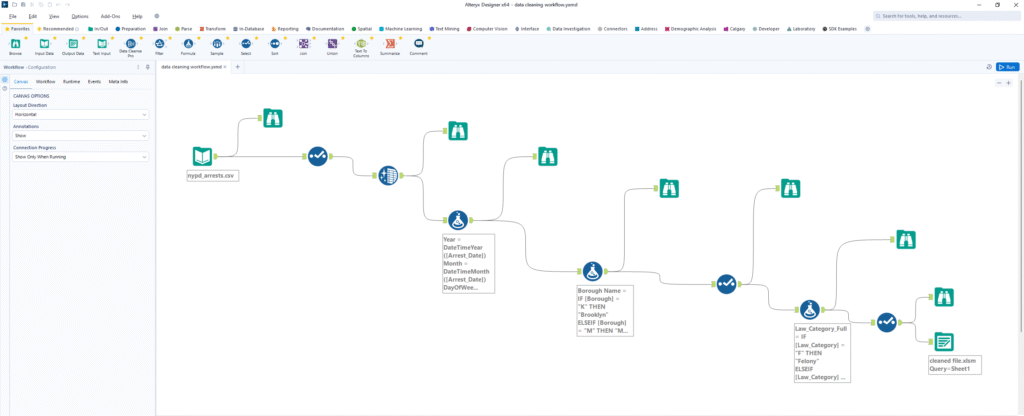
Cleaning with Alteryx
I used Alteryx Designer to build the cleaning workflow. The main tasks were:
- Removing null records and standardizing borough name formats
- Expanding law category codes (Felony, Misdemeanor, Violation) into labeled dimensions
- Formatting date and demographic fields consistently for downstream modeling
Alteryx made it easy to build this as a repeatable workflow. When NYPD releases updated data, re-running the workflow takes minutes.
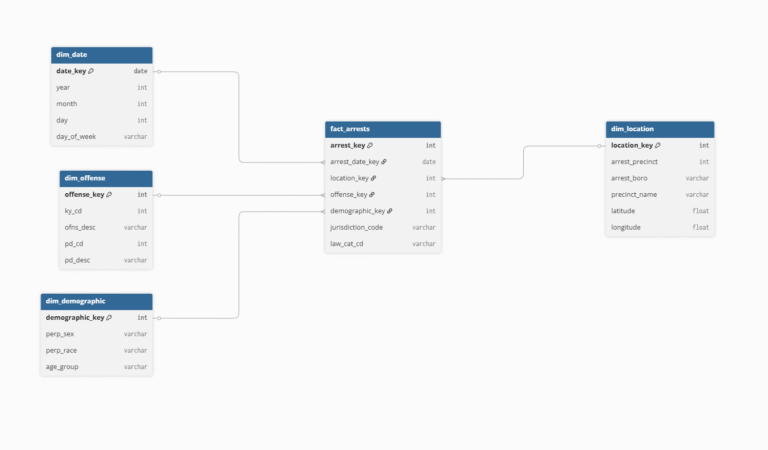
Dimensional Modeling
I organized the cleaned data into a structure connecting dates, offenses, demographics, and locations. This made it straightforward to slice the data across different dimensions in Power BI without writing complex SQL every time.
Loading to BigQuery
I loaded the cleaned records into BigQuery and built SQL analytical views on top. BigQuery handles 500K+ rows with sub-second query response, which made it a practical backend for Power BI without needing to optimize constantly.
-- Arrests by borough and offense category
SELECT
  ARREST_BORO,
  LAW_CAT_CD,
  COUNT(*) AS arrest_count,
  ROUND(COUNT(*) * 100.0 / SUM(COUNT(*)) OVER (PARTITION BY ARREST_BORO), 2) AS pct_of_borough
FROM arrests_clean
WHERE YEAR(ARREST_DATE) = 2024
GROUP BY 1, 2
ORDER BY 1, 3 DESC
The Dashboard
The Power BI dashboard lets you explore arrest trends by time period, borough, precinct, offense type, and demographics. Most of the interesting patterns only become visible once you can cross-filter across these dimensions interactively.
What the Data Showed
- Brooklyn had the highest arrest count among the five boroughs
- Assault and larceny were the most common offenses citywide
- Males aged 25–44 accounted for the largest share of arrests
- Precinct 14 in Manhattan had the highest individual arrest total
- Crime density clusters concentrated in Downtown Brooklyn, Midtown Manhattan, and the Bronx
What I Learned
The most useful insight from this project wasn't about crime patterns — it was about data quality. Raw public datasets are almost always messier than they look. Spending time on profiling before building the pipeline saved a lot of rework downstream. A repeatable cleaning workflow also means the analysis stays current as new data comes in, rather than becoming a one-time snapshot.